With this post we are excited to introduce our Trend Explorer screening model. This specialized set of tools is designed for the exploration of the macro trends that often indicate market direction. With it, you can target specific values from our database for specific funds, or you can take a broader view by averaging or counting values across a group of funds. Based on those values, you can define entry and exit rules for the ETF of your choice and test back to 2002. (Note: The default is a 5-year backtest utilizing SPY as the trade vehicle. Premium Access is required for extended functionality – and is now available for Free for a limited time.)
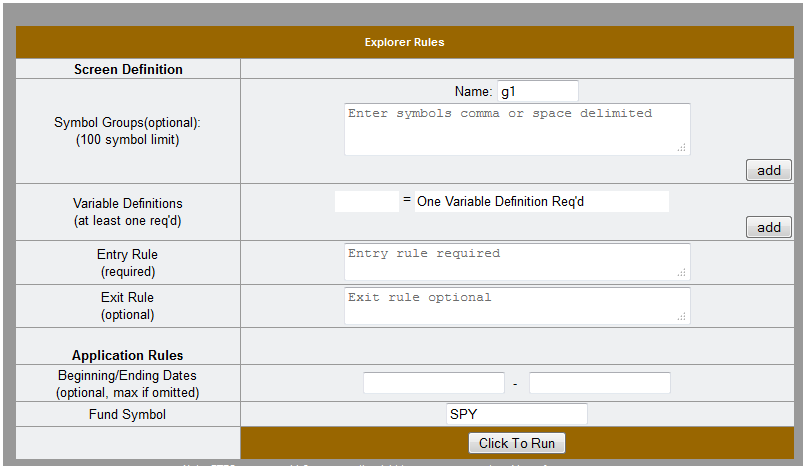
 Above is the basic entry form for the Trend Explorer model. The only required entries are one variable definition and one entry rule. For example, click in the middle of the form where it says “One Variable Definition Req’d”, and a pop-up will lead you through defining your first field.Â
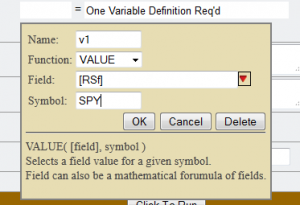
Above is the basic entry form for the Trend Explorer model. The only required entries are one variable definition and one entry rule. For example, click in the middle of the form where it says “One Variable Definition Req’d”, and a pop-up will lead you through defining your first field.  You can leave the Name as the default “v1”. Select VALUE from the drop down and a couple of other fields will show up. Click the red arrow to the right to select [RSf] from the drop-down, and enter a symbol like SPY. Click OK, and you have now defined a field that is defined as the value of [RSf] for SPY or some other symbol. Before we leave this pop-up, note that there is a short description at the bottom to help you with the form. This changes depending on what you select form the ‘Function’ dropdown.
After defining one or more variables we need to define at least an entry rule. For our example, lets enter the entry rule v1 > 50 and click the button to run the model, see it here. If you looked, you’ll see it was not the best model in the world, but it was easy to enter for a first model, and that was the point. The exit rule is optional, and the assumption is made if you do not enter an exit rule, the model will exit whenever the entry rule is false.
Last year I posted about a model that exited the market when the RSf of both XLP and XLV (that’s Consumer Discretionary and Healthcare, respectively) are higher than the RSf for SPY. That is, the model was in the market when SPY had a higher RSf than either one or both of the other two funds. That post was titled When the Defense Leads and code for that model is shown here.  For the past 5-years it has shown a CAGR of about 3.7% vs. 0.4% for the SPY, with a third the drawdown. Not all bad for trading the SPY only.
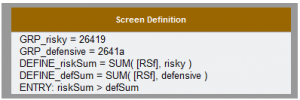
Utilizing some of the other capabilities of our Trend Exporer, we can build on this concept. SPY is not not known to imply bullish sentiment, it represents the broad market. Likewise, XLP and XLV are not the only funds that imply a defensive sentiment. Let us hypothesize that when the bullish funds Industrials (XLI), Technology(XLK), and Consumer Discretionary(XLY) are stronger than the defensive funds Utilities(XLU), Healthcare(XLV), and Consumer Staples(XLP), it is a good time to be invested. The code in the box shows two symbol groups defined.  If you view the screen, you will see I defined my symbol groups like above and then defined two variables that represent the sum of the RSf of the funds in each group. Since there are three funds in each group, and they all existed for the entire time period, I just compared the sums rather than calculating averages, which I’ll show in a later example. By utilizing the three symbols, our CAGR over this time period increased to 7.8% from 3.7% in our prior example. This is a good time, however, for a word of caution. ETFs are relatively new and do not offer a tremendous amount of history to backtest, and the 5 years tested here is minimal. In fact, if you begin these two tests in 2002, like our Premium Access users can do, you will find much closer results. Therefore, be cautious in both the development and the interpretation of any models. That said, let’s see what else we can do.
This model demonstrates averaging of values and entering and exiting using different rules. Basically we define a group of symbols, in this case a group that is highly correlated with IWM, the Russell Small Cap fund. The model calculates the average 2-day RSI for these funds and enters on perceived pull-backs(< 15) and exits on a return to mid-range(> 60).  You will note that we count the number of funds as a variable instead of manually counting how many symbols are in our list. This is because some funds in our list may not have traded over the full history being tested, and by utilizing the COUNT feature we get a valid count and therefore a valid average. While we have an AVG function in the works, we currently must use a combination of SUM and COUNT and then calculate the average in the Entry and Exit rules. This is a bit more cumbersome than we like, but it works. Like the other models mentioned, this model is shown more for demonstration purposes than because we think it has any trading value.
We are very excited by the possibilities this new screener offers and expect many of you will find it beneficial. One early use has been to identify a handful of different models that together could be used to judge market direction. Other uses have focused on trading a particular leveraged vehicle. Whatever your personal use, please note the limitations mentioned earlier and be cautious in your interpretation because backtest results over a short period can be misleading.  May the trend be with you!

The fields under function are not showing up for me.
Ron
Ron,
Thanks for letting me know and please let me clarify. When you click “VALUE” from the drop down box, you are not seeing the two fields “Field” and “Symbol” show up? If not, please let me know what operating system and what browser you are using. I just tried it with Firefox, IE, Safari, and Chrome, and that part seems to be working. I do not have a tablet in front of me at the moment so cannot recheck that. If I mis-read your issue please clarify it for me.
Have a great day, Hugh
I’m using windows 8, IE, thought it might be pop up blocker, but get not notice to allow or not allow, like the site.
thanks Ron
no fields under functions, using ie, windows.
Ron
Ron,
I have still not been able to duplicate this issue. I will be sending you an email with a plan that will hopefully lead to a solution. – Hugh
Your writeup on this addition is rather short. Is there another place where I can really understand the thinking and the methodology?
Ashok
Ashok,
The writeup is rather short and this tool deserves more attention. We are trying to wrap up a couple of changes to the regular screener and then I will try to return to this one. Thanks, Hugh
Really enjoy the traditional screener, but can’t get the new one to work, get the fields, but then get an error message, my computer my be too old, think I have windows 7 and an old IE.
Ron
Can’t get explorer to work, my computer may be too old, have XP and IE 8. Really enjoy the traditonal Screener, it works fine. thanks
Ron